
The national picture shows that over the year listenership to radio slipped by one point to 83% or 2.9m people daily. In fairness it’s marginally ahead of the previous survey (Q1) by some 13,000 listeners. National radio listenership is up by 22,000 in the twelve months and home local stations dropped by 51,000.
Looking at the individual stations the big performer again this survey was Newstalk adding 77,000 listeners (+27%) to bring them into double digits and 365,000. Had the numbers been a little kinder to them they could have leaped to third spot in the national rankings as 2FM are only 1,000 listeners ahead and if the trend continues might fall a place in the next survey. Much of Newstalks increases are down to the morning schedules – primarily Pat Kenny and Breakfast – the latter now being the most listened to slot on the station.
Today FM also made some gains rising to 458,000 listeners or 13% and it Newstalk and Lyric were the only stations to see an increase in listeners over the year. Radio 1 fell by 15,000 but still leaves them at a comfortable 24% reach (849,000) way ahead of its nearest rival Today FM. 2FM continued on its downward trajectory coming in at 366,000 (10%) and Lyric added a healthy 19% to finish at 138,000 (4%).
| Station | 14Q2 | 13Q2 | +/- | +/- | +/- | ||||
| Any Radio | 83% | 2982 | 84% | 3012 | -1% | -30 | -1% | ||
| Any National | 46% | 1641 | 45% | 1619 | 1% | 22 | 1% | ||
| Home Local Station | 42% | 1497 | 43% | 1548 | -1% | -51 | -3% | ||
| Any RTE Radio | 34% | 1216 | 34% | 1229 | 0% | -13 | -1% | ||
| Any RTE1/2FM/Lyric | 33% | 1195 | 34% | 1210 | -1% | -15 | -1% | ||
| RTE Radio 1 | 24% | 849 | 24% | 864 | 0% | -15 | -2% | ||
| Today FM | 13% | 458 | 13% | 449 | 0% | 9 | 2% | ||
| RTE 2FM | 10% | 366 | 11% | 382 | -1% | -16 | -4% | ||
| Newstalk | 10% | 365 | 8% | 288 | 2% | 77 | 27% | ||
| Other Regional | 7% | 266 | 7% | 269 | 0% | -3 | -1% | ||
| RTE Lyric FM | 4% | 138 | 3% | 116 | 1% | 22 | 19% |
To get a clearer numerical picture over time I’ve added the table below showing the last four surveys. Radio is a movable feast so it’ s good to keep an eye on the rolling surveys as well as the current one.
| 14Q2 | 14Q1 | 13Q4 | 13Q3 | |||||
| Any Radio | 2982 | 83% | 2969 | 83% | 2972 | 83% | 2995 | 83% |
| Any National | 1641 | 46% | 1618 | 45% | 1632 | 45% | 1624 | 45% |
| Home Local Station | 1497 | 42% | 1491 | 42% | 1488 | 41% | 1523 | 42% |
| Any RTE Radio | 1216 | 34% | 1217 | 34% | 1232 | 34% | 1231 | 34% |
| RTE Radio 1 | 849 | 24% | 845 | 24% | 849 | 24% | 861 | 24% |
| Today FM | 458 | 13% | 442 | 12% | 461 | 13% | 457 | 13% |
| RTE 2FM | 366 | 10% | 376 | 10% | 394 | 11% | 384 | 11% |
| Newstalk | 365 | 10% | 334 | 9% | 315 | 9% | 294 | 8% |
| Other Regional/Local Station | 266 | 7% | 261 | 7% | 264 | 7% | 269 | 7% |
| RTE Lyric FM | 138 | 4% | 128 | 4% | 127 | 4% | 120 | 3% |
Below are the numbers but graphic form giving a better picture of the overall trend in National Radio. I’ve added an indexed graph in the last tab to show the major radio groupings and how they have fared over the past twenty two surveys. It’s an interesting take on the radio landscape showing that National and Home Local stations have their work cut out for them and the non-national group is being strengthened by modest increased in Regional and Multi city listenership.
[module-293]
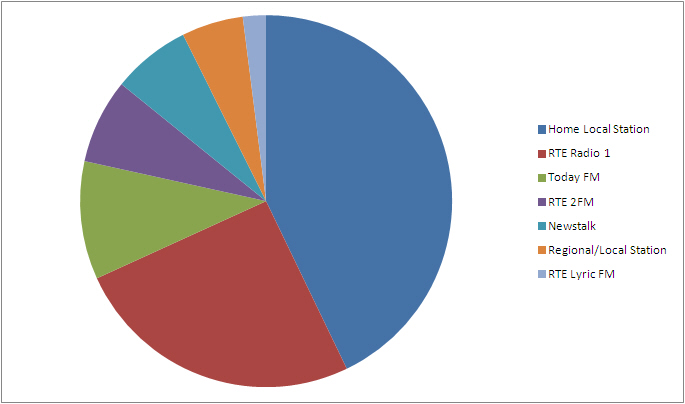
Market Share
Moving to the market shares it shows the dominance of RTE1 in the market being close to fourteen share points ahead of Today FM. The national broadcaster did drop share during the year being picked up by Today FM and Newstalk who grew their share to 9.2% and 6.1% respectively. The share is interesting as it shows that there is a credible alternative to the nationals in the home spun stations who collectively have a share of 38.4% as opposed to 47.1% for the nationals.
| Station | 14_2 | 13_2 | +/- |
| Any Radio | 100.0% | 100.0% | 0.0% |
| Any Region/Local/M-City | 52.9% | 53.0% | -0.1% |
| Any National | 47.1% | 47.0% | 0.1% |
| Home Local Station | 38.4% | 39.2% | -0.8% |
| Any RTE Radio | 31.9% | 33.0% | -1.1% |
| Any RTE1/2FM/Lyric | 31.2% | 32.4% | -1.2% |
| RTE Radio 1 | 22.7% | 23.4% | -0.7% |
| Today FM | 9.2% | 9.1% | 0.1% |
| RTE 2FM | 6.6% | 7.3% | -0.7% |
| Newstalk | 6.1% | 4.8% | 1.3% |
| Other Regional/Local Station | 4.8% | 4.9% | -0.1% |
| RTE Lyric FM | 1.8% | 1.7% | 0.1% |
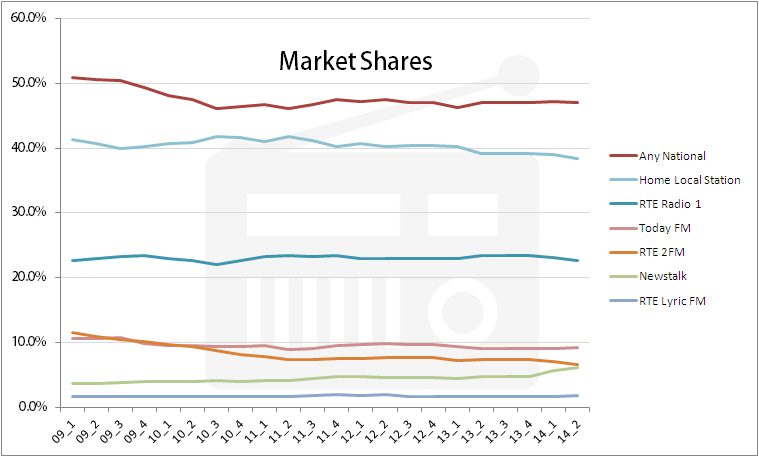
The pie graph above would make more than 100% (for a variety of different reasons) but it serves to illustrate the two dominant forces in terms of market share – National and home local. As does the graph below, which charts the market shares of the various stations over the past five years to give you a better picture of where the stations are going trend wise
To see how the stations manage to win their share and reach you have to look at the constituent parts of each station measured against each other. In this illustration the first tab 07:00 to 23:00, showing the day as a whole looks very much like an unfair fight with RTE dominating by a stretch up to the late evening. The final tab is another interesting take showing the quarter hours for the major players and the grouped home local stations – puts the power of local into perspective.
[module-292]
In the immortal words of Magnus Magnusson “I’ve started so I’ll finish’ so I’ll turn again to Pat Kenny. I’ve tracked his potential listenership over the year to try and get a jump on proceedings and below is that analysis (you can look back over previous surveys to see the methodology and finer detail). With Pat at 134,000 at this late stage (with only two months left for a full year in Newstalk) it would suggest that the out turn for the year would be between 137,000 and 150,000. I thought that he’d be kingpin in the station by now and I was slightly blindsided with Newstalk Breakfast taking top spot this survey (147,000) – and no disrespect to the Breakfast show in that.
