
Newspapers ABC Circulation July-Dec 2012

Before we get into each specific market it’s worth looking at the big picture. The market as a whole is down 6% with the morning and evenings falling by 7% in the year. The market has lost 100,000 copy sales in a short twelve month period and you can see from the graphics below that […]
Sunday Newspapers ABC July-Dec 2012
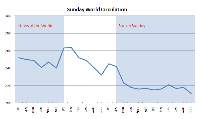
The Sunday market, at 865,000, is down 6% on the same six months as last year, a drop of 55,000 copies in twelve months. The Sunday Market headline has to be dominated by the 14% decline in circulation of The Sunday World dropping 34,000 to 217,000. While there are, on the surface, grater declines for […]
Morning Newspapers ABC July-Dec 2012

In the six months to December 2012, the morning market fell by 7% or 39,000 copies per day compared to the same six months in 2111. The biggest faller in percentage terms was the Daily Star dropping 13% or just over 10,000 copies. This is followed by The Sun, down 8% and the Irish Times […]
Regional Newspapers ABC Circulation July-Dec 2012
The decline in the number of Regional Papers being part of the ABC process is falling at a pace. Two years ago there were nearly 45 papers (paid for) certified by the ABC, now only 24 decide to confess annually or bi-annually. The only papers to record an increase are the Echo in Dublin and […]
Evening Newspapers ABC June-Dec 2012
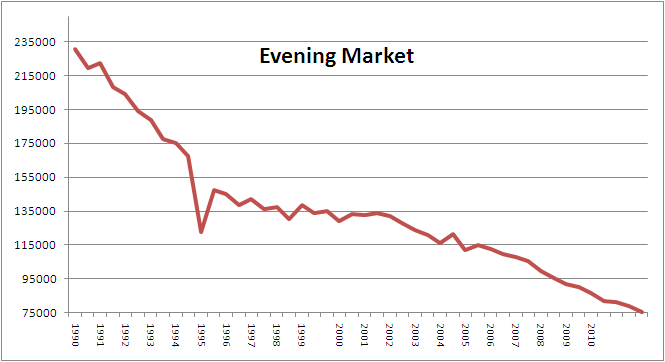
Just to cover the whole market, you’d have to look at the Evening market. Although you can hardly call one local paper in Dublin and another in Cork a ‘market’. Anyway… Publication JD 2012 JD 2011 Diff ‘000 Diff % Evening Herald 58,826 62,414 -3,588 -6% Echo 16,560 18,632 -2,072 -11% Total 75,386 81,046 -5,660 […]
JNRS 2012
If you wanted to actually see the definition of ‘being at odds with’ then you only have to look at the latest results from the JNRS and see how alien it is to monthly circulation data. Circulation numbers are easy to see in theses many and varied digital outpourings and they paint a fairly […]
RTE Web Statistics October 2012
The October RTE web stats dropped in today showing that the broadcaster had a 6% rise in daily traffic over the year although its daily page impressions were down close to two percent- more volume, slightly less engagement. But, on average each person looks at about eight pages per visit. Curiously, their streams were […]

