We’ve had no toys to play with lately, until this email dropped in from the ABC announcing the certification of our own independent.ie based on traffic in July 2014. Their last cert was released in March 2012 so in the intervening thirty two months something must have changed!
And as much as that “thirty two months” quip is somewhat mocking at the breakneck speed of this digital media business, at least the Independent have, finally, provided some digital data whereas the rest of the players in the Irish Digital Media landscape are completely bereft of any publicly available digital data at all.
Independent.ie has released certificated before in 2010 and 2012 and, in order to draw a comparison, we have to set out their stall. In each year they have included a description of what exactly independent.ie is. Below is a table for each year and what the certificate says was measured as part of the independent.ie
| 2014 | 2012 | 2010 |
| www.independent.ie | www.independent.ie | Independent. ie |
| http://m.independent.ie | http://photos.independent.ie | www.independent.ie |
| http://searchtopics.independent.ie | http://independent-ie.hemscott.com | |
| http://competitions.independent.ie | ||
| http://weather.independent. ie |
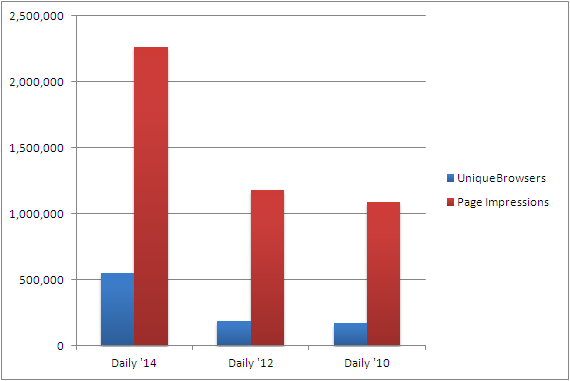
So, now that the technical issues are out of the way we can move swiftly on to the numbers. The cert shows that independent.ie gets just over half-a-million unique browsers every day which in turn generate 2.26m page impressions for the site. That’s an increase of 192% in uniques since 2012 and a 91% increase in page impressions.
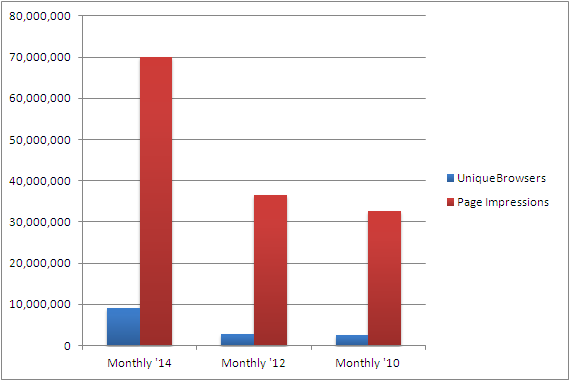
Every month the site is visited by 9.19m unique browsers and over 70m pages are viewed every month. This represents an increase of 233% in unique per month and 91% in pageviews. Just for comparisons: rte.ie last certificate was in October 2012 where they had 443,933 uniques per day and 3,910,733 page impressions per day.
| Daily ’14 | Daily ’12 | Daily ’10 | Monthly ’14 | Monthly ’12 | Monthly ’10 | ||
| UniqueBrowsers | 548,228 | 187,886 | 173,232 | 192% | 9,190,144 | 2,758,631 | 2,475,348 |
| Page Impressions | 2,260,128 | 1,181,444 | 1,086,556 | 91% | 70,063,983 | 36,624,756 | 32,596,670 |
| Page Per Unique | 4.12 | 6.29 | 6.27 | 7.62 | 13.28 | 13.17 |
While the traffic growth is very positive and aggressive in growth, the engagement metric seems wanting. Two years ago the average visitor “thumbed” through just over six pages per visit but this has dropped by two pages to just over four pages per visit in 2014. Doubtless other media companies in Ireland are seeing a similar trend with people becoming less brand loyal to one site and visiting a plethora of sites to gather their news on a daily basis.
Whilst any data is good, I find the quality, in comparison to the certificates of say the dailymail.co.uk or the guardian.co.uk, lacking. There’s no breakout of the browser type showing the device used to view the site. I know for example that 47% of the traffic to guardian.co.uk is from a mobile device (handy of you’re an advertiser). Similarly, there’s no geographic breakdown so the 548,228 uniques is very much a take it or leave it figure.
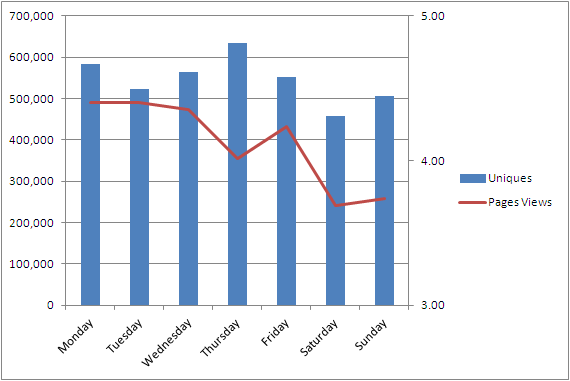
Finally an interesting average for that month showing the day of the week and the page views per day. In July Thursday was their busiest day and Saturday was their slowest by some 25% on the busiest day. Not only was Saturday quiet in terms of visitor numbers, their pageviews for the day were the smallest as well.